KNOM Element Five, data through intuition and intuition through data: Part 6


SAKET BIVALKAR
Business Coach
“Data is like garbage. You’d better know what you are going to do with it before you collect it.” – Mark Twain.
When I sat out to develop a new operating model, I knew it would follow principles of whole-scale change and dynamic knowledge sharing. This fed into the core tenets and topics covered in the prior parts of this article series. However, it leaves the final part unturned: how consistent change could be instigated through knowledge.
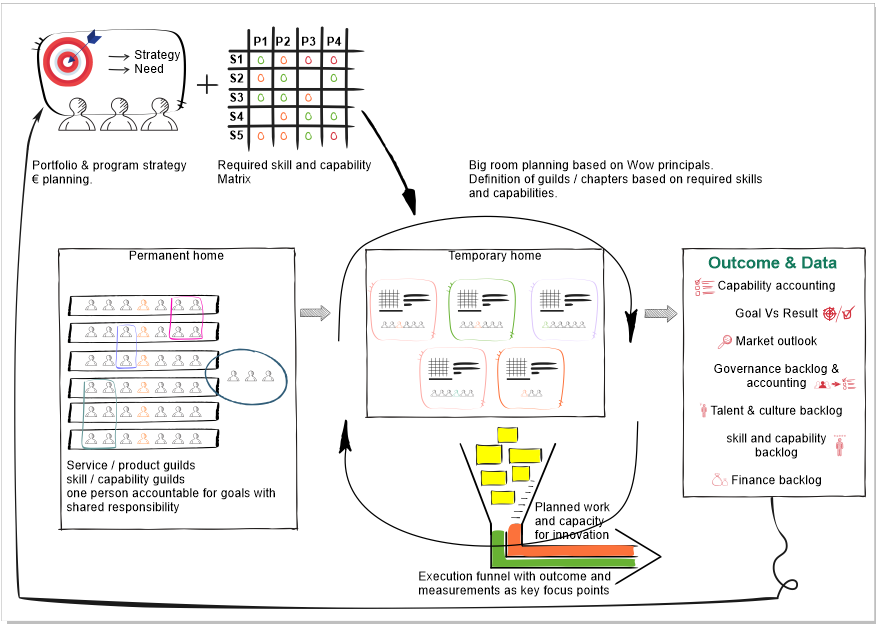
Central to the KNOM organisation is the constant iteration and adaptability built into its fabric. The knowledge part of the KNOM comes in part through the skills and capabilities shared between its people. But also, and prudent to this final article, knowledge utilised for iteration and change from Element Five: Outcome & Data Insights.
The circling arrow illustrating the feedback loop central to the KNOM organisation originates from Outcome & Data Insights: it is the lifeblood of the structure.
In one sentence, Element Five: Outcome & Data Insights is “a part of the KNOM that aggregates and dissects data into actionable insights, interdependent and independent from the other elements in KNOM”.
To avoid having data smelling like rubbish, as Mark Twain wittingly put it, is to establish beforehand the aims the data must generate insights towards and help to improve. We established in Element Four that each pilot program, ensured by the Owner, will integrate data aggregation based on the five risk dimensions covered in Element Three: financial, legal, technical, social, and operational.
This is helpful on a top level, but practically, we need to delve a bit deeper.

The data pyramid
“Data is a tool for enhancing intuition.” – Hilary Mason, data scientist and founder of Fast Forward Labs.
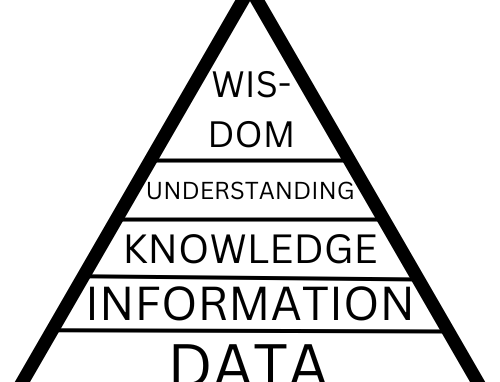
In my practice of advising enterprises on business strategy and operational models, a key part is the aggregation, handling and extraction of insights from data. This last part is crucial and is where most fall short. Thus, I will echo the brilliant explanation of ‘what data is’ from Daniel Hulme, PhD in Engineering, lector at the London School of Economics and Political Science (LSE), and CEO of the AI company Satalia.

At the bottom of the pyramid is raw data. Data by itself is just symbols without context. I can say 0-1-0-7-2-3, and they would mean nothing: it is just an assortment of numbers. But when I give it context by saying it is a calendar date, the raw data turns into usable “information”.
Now, let’s be more nuanced as we move up the pyramid.
Imagine a spreadsheet of three columns:
- Dates during the summer months.
- How warm in degrees the weather is.
- Ice cream sales.
Turning this “information” into “knowledge” is to figure out patterns within it. So for this example, we can see the simple correlation between ice cream sales and the heat of the Summer. Even better, by upgrading our “knowledge” to “understanding,” we know that the reason people like to go outside when it is warm is to cool themselves by eating ice cream. So we utilise this understanding and link our manufacturing of ice cream to the weather forecast, optimising our cost of manufacturing with expected sales of ice cream. Simple.
However, what happens when it gets unfathomably hot outside? People stay indoors to escape the heat. So we implement a variable stating that when the temperature gets above a certain level, the ice cream manufacturing turns off. This is “wisdom” and is the highest level of data insights we can garner from our intuition. It is using data insights with the instincts and intuition humans have. That is why Hilary Mason said that data is a tool to enhance our intuition: it is to improve our wisdom.
Outcome & Data Insights in categories
With this perspective on data and the insights garnered from it, Element Five: Outcome & Data Insights proceeds through all the levels of the pyramid in different categories. And while more categories exist for each KNOM organisation, these six categories are the most commonly utilised: Capability Accounting, Goals Vs Results, Market Outlook & Changes, Governance Backlog & Accounting, Talent & Culture Backlog, and Finance Backlog.
Here is what each of these categories is.
Capability Accounting & Skills Backlog
This category measures the relationship and performance between the Skills & Capabilities, explained in part two of this series, with the development of the Temporary Programs and in the final delivery in the Execution Funnel. In short, if any gaps in Skills & Capabilities would improve the completion of future KNOM processes. This is then sent to Element Two: Strategy Formation & Planning, which then adapts future Skills & Capability matrixes shown in Big Room Planning.
Goals Vs Results
Simply, this category is the relationship between what goals were expected and which results ended up being measured. While it also is about uncovering the reasons behind the possible disconnects between the two.
Market Outlook & Changes
Following the Temporary Program cycle of three months, this time horizon looks at changes in the market and customers while attempting to predict how the next three months will aid the following KNOM cycle.
Governance Backlog & Accounting
This category covers how the KNOM organisation governed its operations and activities and if any changes based on KPI results would be necessary.
Talent & Culture Backlog
Talent & Culture Backlog investigates correlations between the current needs, wants and desires of the organisation’s people contrasted with what is delivered.
Finance Backlog
This one measures the relationship with the budgets, costs, and financial impact of each Temporary Program/Pilot Program. Effectively, the Finance Backlog ensure financial solvency and ROI for each KNOM activity.
As we alluded to in the definitions of each category, Element Three: Outcome & Data Insights operates with data sets and analysis for a period of two to three months, mirroring the Temporary Programs/Pilot Programs duration.
However, a crucial point with Outcome & Data Insights is that this element operates independently from the others. This means that it is capable of delivering insights based on intuition and wisdom to Element Two: Strategy Formation & Planning that span longer than two to three months.
In summary, the pivotal importance of Element Five: Outcome & Data Insights is to begin the process well before it starts. As then, the KNOM organisation avoids data smelling like rubbish because you know their predetermined plans. Similarly, treat the data and subsequent analysis of it into actionable and valuable insights as different levels of intuition and wisdom. Data by itself is useless – not even AI can achieve data insights above certain pyramid levels – only people have the wisdom to continually optimise and improve the organisation through the data.
In the final epilogue of this article series, we will summarize the key points we have gathered and where you can adapt this framework to your organisation.
Realising your Strategy: The Critical Role of Operating Models
Organizations must continuously adapt and evolve to stay ahead of the competition. One key factor in achieving realisation of strategy is the operating model, which serves as the foundation for execution and provides a clear guide for how resources are organised to get critical work done.
Learning to Change: How Organizational Learning Fuels Transformation
From the importance of leadership support to leveraging technology for accessible learning, we cover the essential elements that make learning the heartbeat of organizational transformation.
Deciphering the Essence of an Operating Model
Explore the essence of operating models in business transformation. Uncover components, real-world insights, and the path to organizational brilliance. #BusinessTransformation #OperatingModels


